How to Track Smart Money in Stocks: 5 Signals Every Investor Should Know
The Market Often Leaves Clues Before the Headlines Arrive
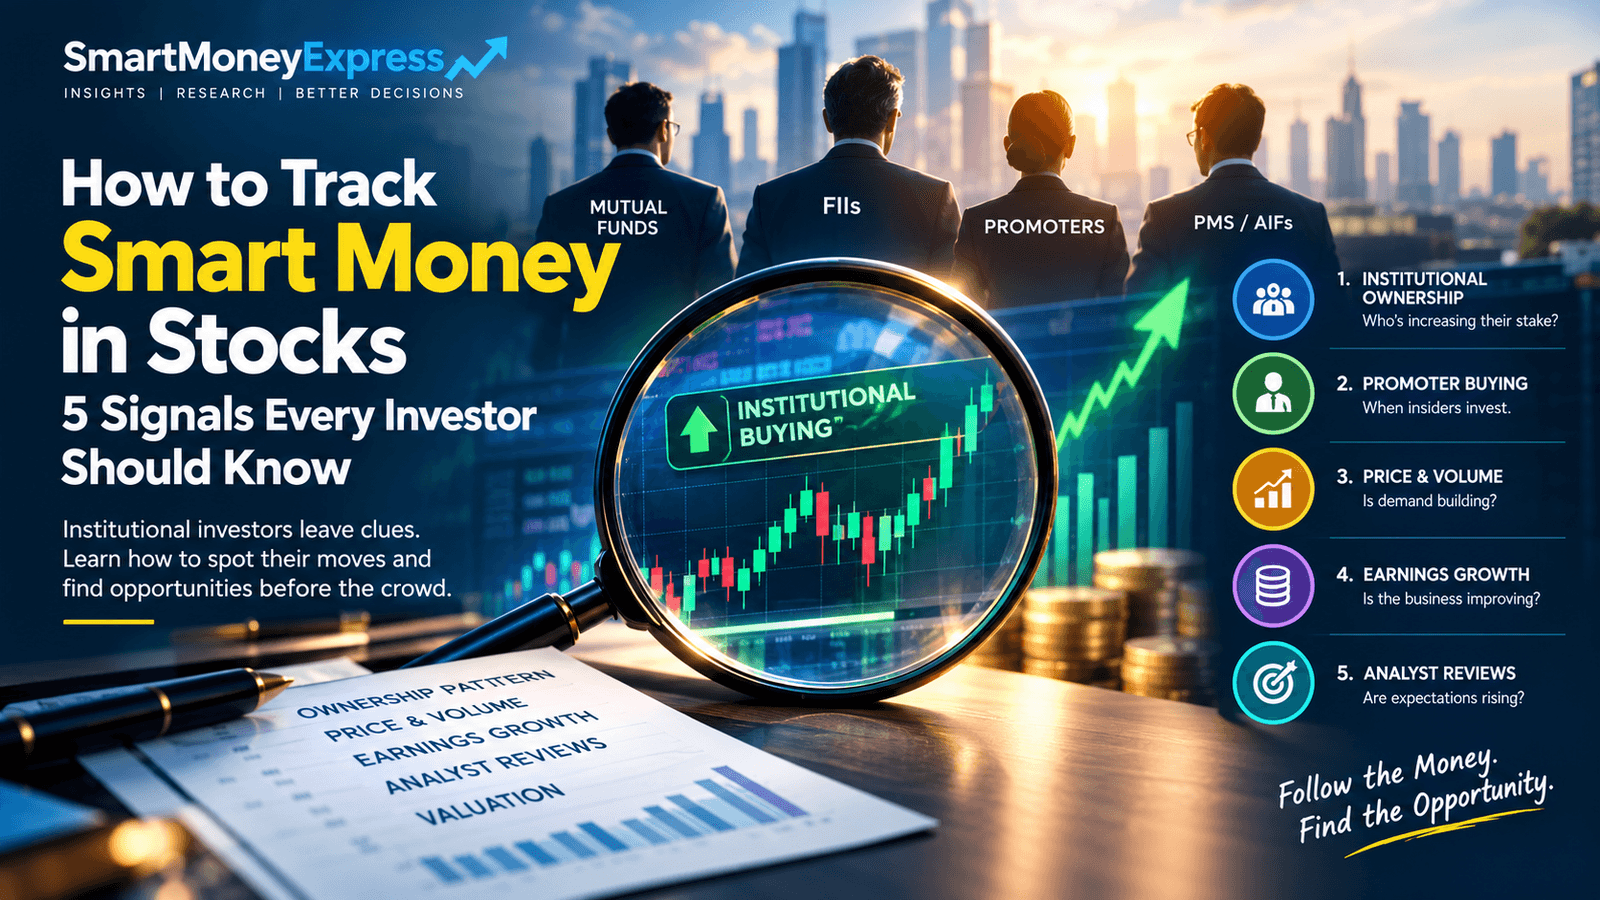
Most retail investors spend their time searching for the next multibagger, following market tips, studying price targets or reacting to the latest business news. Yet some of the most useful investment clues may be found elsewhere: in the movement of capital.
When mutual funds increase their holdings in a company, promoters acquire additional shares, several sophisticated investors independently build positions, or a stock begins attracting unusually strong buying interest, these developments can offer valuable insights into how the market is evaluating a business.
This is the essence of tracking smart money — studying the actions of major investors to understand which companies may be attracting growing financial interest and why.
It is not about blindly copying a billionaire's portfolio or buying a stock simply because a mutual fund owns it. It is about connecting the dots between ownership changes, business performance, valuation and market behaviour.
For investors willing to look beyond daily price movements, these clues can help build a more informed view of the opportunities emerging in the stock market.
What Exactly Is Smart Money?
The term smart money generally refers to investors or institutions with substantial capital, research capabilities, investment experience or access to detailed business information.
In the Indian equity market, this group can include:
- Mutual funds and insurance companies managing large pools of long-term savings.
- Foreign institutional investors (FIIs) investing in Indian companies and broader market opportunities.
- Promoters and company insiders who may have deep knowledge of their businesses.
- Portfolio Management Services (PMS) and Alternative Investment Funds (AIFs) making concentrated or specialised investments.
- Respected individual investors and family offices with identifiable investment philosophies.
- Private equity and strategic investors taking significant positions in businesses.
These investors are not a single, coordinated group. They have different objectives, investment horizons, mandates and risk tolerances. One institution may buy a stock because it expects earnings to accelerate; another may buy it because it is entering an index; a third may be taking a short-term trading position.
Consequently, smart money is best understood as a collection of investment signals — not a guarantee of superior returns.
Why Large Investors Can Influence Stock Prices
Imagine a mutual fund deciding to invest ₹500 crore in a company whose shares have limited daily trading volume.
It cannot necessarily acquire the entire position immediately without pushing the share price higher. Instead, the fund may accumulate shares over several trading sessions or weeks, depending on liquidity, available supply and its execution strategy.
When buying demand consistently exceeds the shares being offered for sale, prices may strengthen. If other investors subsequently recognise improving business prospects, demand can increase further.
However, the reverse is equally important. Institutions can sell large positions, and their purchases do not always result in sustained price appreciation.
The useful question is not simply whether large investors are buying. It is whether their activity is consistent with improving business fundamentals and a constructive price trend.
Five Signals That Can Help You Follow Smart Money
1. Rising Institutional Ownership: Who Is Increasing Their Stake?
One of the most accessible ways to investigate institutional interest is to compare a company's shareholding pattern across successive quarters.
Look at changes in ownership by mutual funds, foreign portfolio investors, insurance companies and other disclosed institutional categories.
A company becomes more interesting when institutional ownership rises consistently across several reporting periods, particularly when the number of investing institutions also increases.
But examine the details. Is one institution building a meaningful position, or has the change resulted from a passive index fund? Have existing investors increased their stakes, or have new investors entered? Has the overall institutional percentage risen because promoters or other shareholders sold shares?
What to look for: sustained ownership increases, multiple credible investors building positions and a trend that can be explained by the company's fundamentals.
Investors can begin this research through quarterly shareholding disclosures available via the NSE and company filings in Indian market and form 13 disclosures in US market
One limitation is important: quarterly ownership data is a snapshot, not a live record of every trade. It can reveal a developing trend, but may not show exactly when a fund started buying.
2. Promoter Buying: When Business Owners Put More Capital at Risk
Promoter transactions deserve a separate place in any smart-money framework.
Promoters often possess deep operational knowledge of their companies, including their competitive position, expansion plans and long-term prospects. When promoters purchase additional shares with their own funds, it can indicate confidence in the business.
The signal becomes more interesting when promoter buying occurs alongside improving financial performance, a manageable balance sheet and a share price that has corrected materially.
However, promoter ownership changes require careful interpretation. A pledge release is not the same as a share purchase. An increase in percentage ownership may result from a reduction in the total number of shares rather than a fresh investment. Transactions between related entities may also have different implications from an open-market purchase.
Likewise, promoter selling is not automatically negative: it may reflect personal liquidity needs, succession planning or other reasons.
What to look for: the actual transaction, the quantity purchased, the price paid, the promoter's previous holding and the financial condition of the company.
The objective is to understand the transaction rather than attach a bullish or bearish label to it.
3. Price and Trading Volume: Is Demand Becoming Visible?
Ownership disclosures tell us who holds shares at particular reporting dates. Price and volume can provide a more immediate view of market activity.
Suppose a stock spends several weeks trading within a relatively narrow range. During that period, its price repeatedly recovers after modest declines, and trading volume expands on stronger sessions.
This can suggest that demand is absorbing available supply.
If the stock subsequently moves above an established resistance level on unusually strong volume, it may indicate that buying interest has become more forceful.
But chart patterns cannot identify the buyer with certainty. High volume could reflect institutional accumulation, speculative activity, short covering, news-driven trading or a large shareholder's exit.
What to look for: sustained relative strength, constructive price consolidation, stronger volume during advances and a breakout supported by credible business developments.
The strongest interpretation comes when the chart agrees with the ownership and fundamental evidence, rather than when a single technical signal is treated as proof of institutional buying.
4. Earnings Growth and Business Quality: Why Would Institutions Want the Stock?
Capital flows are more informative when viewed alongside the company's financial performance.
Professional investors may be attracted to companies where revenue is expanding, profit growth is sustainable, margins are improving or the business is gaining market share.
Consider a company reporting accelerating sales, higher operating profits, improving return on capital and manageable debt. If institutional ownership also rises while the stock demonstrates relative strength, several independent signals may be pointing in the same direction.
The reverse deserves equal attention. Institutional buying alone cannot compensate for deteriorating cash flows, aggressive accounting, excessive debt or an unsustainable valuation.
Useful measures include:
- Revenue and profit growth over several years.
- Operating margins and their direction of travel.
- Return on equity (ROE) and return on capital employed (ROCE).
- Operating cash flow compared with reported profits.
- Debt levels, interest costs and working-capital requirements.
- Management guidance and changes in earnings expectations.
There is no universal growth threshold that makes a company institution-worthy. The appropriate benchmarks differ between a bank, a consumer business, a commodity producer and an early-stage technology company.
The important question is whether the business is becoming more valuable and whether the current share price adequately reflects that improvement.
5. Earnings Revisions and Market Leadership: What Could Happen Next?
Historical financial statements explain what a company has already achieved. Forward-looking expectations help investors assess what may come next.
When analysts revise earnings forecasts upwards after results, management guidance or new order wins, the revisions can signal that the company's future profitability is being reassessed.
The signal is stronger when several analysts independently improve their estimates and the underlying reasons are supported by evidence.
Investors should also compare a stock's performance with its sector and the broader market. A company that continues to outperform its peers while delivering stronger results may be emerging as a market leader.
Nevertheless, expectations are not facts. Forecasts can be wrong, and even a high-quality company can disappoint if its share price already assumes exceptional growth.
What to look for: improving earnings expectations, credible reasons for the upgrades, relative strength against peers and a valuation that leaves room for uncertainty.
Build a Smart Money Scorecard — Instead of Following One Signal
Rather than treating any single indicator as a buy signal, investors can organise their research into five questions.
Research question | Evidence to examine |
Who is buying? | Promoter transactions and institutional ownership changes |
Is demand visible? | Price action, trading volume and relative strength |
Is the business improving? | Revenue, earnings, margins and cash flow |
Are expectations improving? | Analyst revisions, order wins and management guidance |
Is the price reasonable? | Valuation versus growth, peers and historical ranges |
A company that scores well across several dimensions may deserve deeper investigation. A stock showing institutional accumulation but weak cash flows, declining earnings or an excessive valuation needs much greater caution.
This framework is a research filter, not an automatic stock-selection formula.
The Biggest Mistake: Assuming Smart Money Is Always Right
Institutional investors make mistakes, just like individual investors. They may buy at the wrong valuation, misjudge an industry cycle or underestimate competitive threats. Some institutions trade over short periods, while others hold positions for years.
There is also a timing problem. Public shareholding data may reveal that ownership increased during a quarter, but the stock could already have risen substantially by the time the information becomes available.
That is why investors should avoid buying solely because a well-known fund, promoter or investor owns a stock.
The more useful approach is to ask three questions:
- Why might this investor be interested in the company?
- Does the company's financial performance support that interpretation?
- Does the current valuation offer a reasonable margin of safety?
These questions turn smart-money tracking from a copying exercise into an independent research process.
The Smart Money Express Perspective: Follow the Evidence, Not the Hype
The most valuable investment clues often emerge when different pieces of evidence begin to align.
Institutional ownership may be rising. Promoters may be increasing their exposure. Revenue and cash flows may be improving. The share price may be outperforming its peers. Analysts may be revising expectations upwards.
No individual signal guarantees success. Together, however, they can help investors identify companies that deserve closer attention before a story becomes widely discussed.
Smart money leaves information behind — but it is up to the investor to interpret it correctly.
At Smart Money Express, our approach is to follow capital flows, investigate the businesses attracting that capital and examine the financial and market evidence behind the activity.
Because the real objective is not to imitate another investor's trade. It is to understand the reasoning, test the evidence and make better-informed decisions.
Disclaimer: This article is for informational and educational purposes only. It does not constitute investment advice or a recommendation to buy or sell any security. Institutional and promoter transactions can be misleading when viewed in isolation. Investors should conduct independent research and consider their own financial circumstances and risk tolerance
Smart Money Express publishes financial journalism, not investment advice. Nothing here is a recommendation to buy or sell any security. Flow indicators describe observed institutional activity over a stated period; they are not ratings and carry no view on future prices. Do your own research or speak to a registered adviser.
Comments
No comments on this piece yet. Yours would be the first.
Leave a comment
Comments are read before they appear. Your email address is never published.
Please keep it civil and on the subject of the article. We remove anything defamatory, and we cannot answer questions about what to buy or sell.